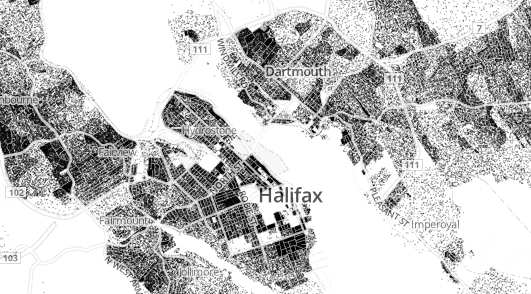
A close up of Halifax and Dartmouth NS in the Census Dotmap.
Continuing our map theme. Brandon Martin-Anderson (who works with cartography, multimodal trip planning, and computational urban planning at the MIT Media Lab) developed what he calls the Census Dotmap which is a map of every person counted by the 2010 US and 2011 Canadian censuses. The map has 341,817,095 dots – one for each person. Wow. What a lot of work. It is also quite interesting when you zoom in. This is based on the open source Google Maps platform. A great way to present visual data.
Of course when you rely on public data – data sourced from the public directly such as a census – you are bound to have mistakes, hence the FAQ of “This says someone lives in the middle of a lake: The census reported that someone lives in a block which includes a lake, and that’s where their dot was randomly placed. Also, some people live in the middle of lakes.”
Recent Comments